Explore Spectrum
The Spectrum tab shows the waveform above a spectrogram. A spectrogram shows how the signal's frequency content changes with time. Color represents the strength of that frequency content.
- Open a recording or connect a SpikerBox.
- Select Spectrum at the bottom.
- If more than one channel is available, choose the channel with the channel control.
- Play the recording or watch the live signal. Compare a change in the waveform with the frequency pattern below it.
- Pause playback to inspect a section, or move to another time in the recording.
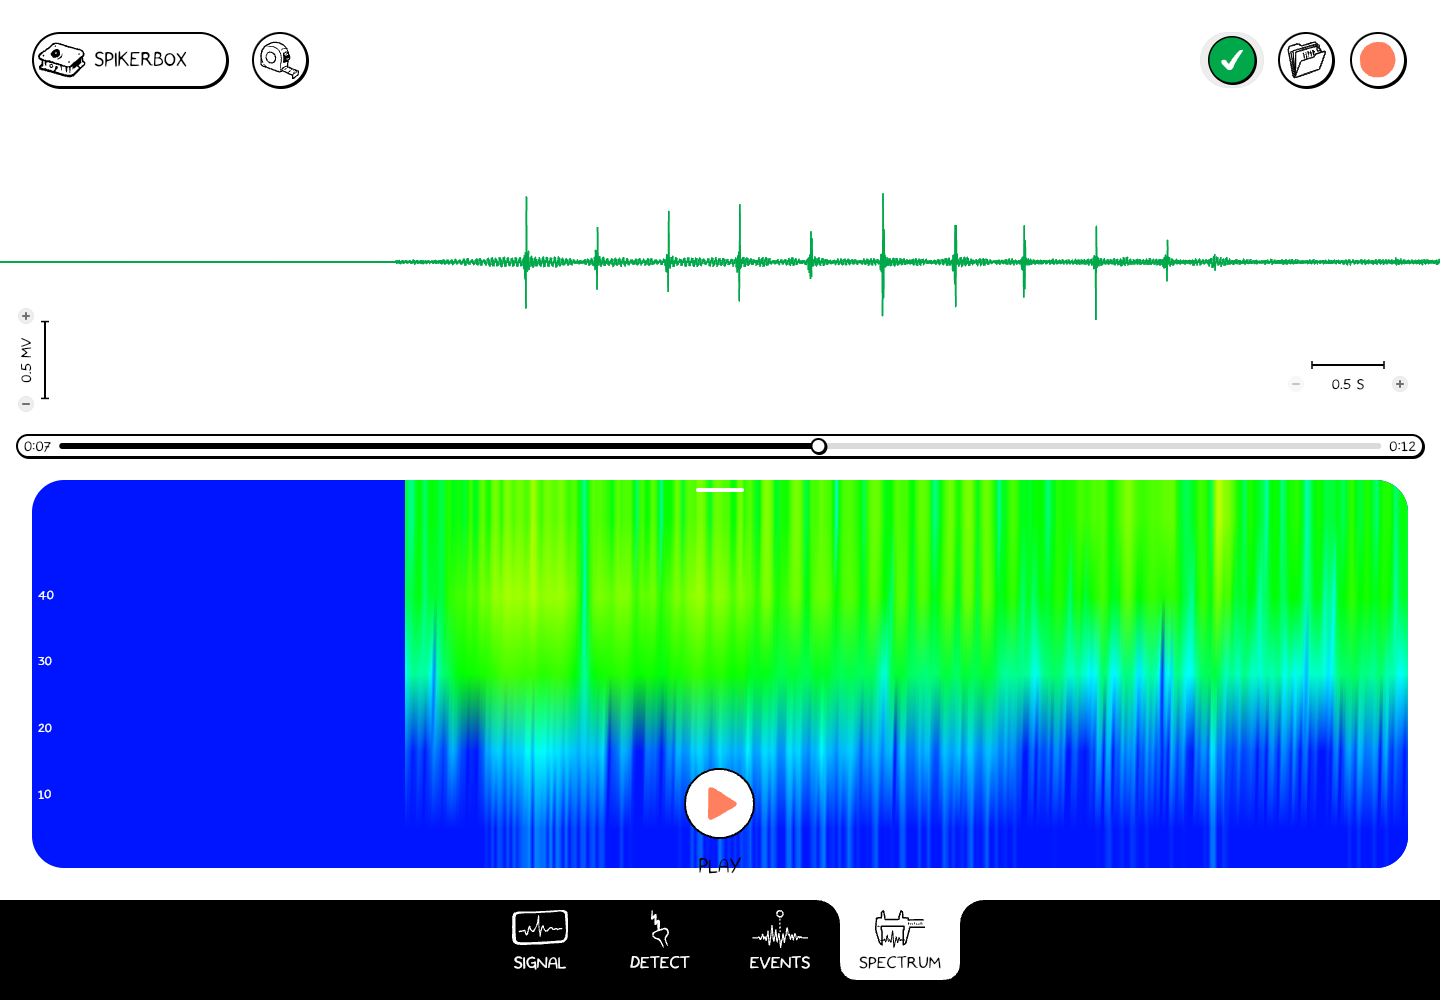
The sample recording in Spectrum. The upper waveform and lower spectrogram are two views of the selected signal.
Read the axes and scales when comparing intervals. A persistent frequency band may come from the biological signal, electrical interference, or the recording setup; use the experiment and device setup to interpret it.
To measure a time interval on the waveform, return to Signal and Measure.